
- 139
- 1 344 638
LiquidBrain Bioinformatics
Malaysia
Приєднався 16 гру 2016
Frustrated at the state of bioinformatics education and R programming, I created my own.
Email: liquidbrain.r@gmail.com
Github: github.com/brandonyph
Github: github.com/Lindseynicer
Twitter: Brandon_yeoph
Twitter: LianFoong/
Website: www.liquidbrain.org/videos
Email: liquidbrain.r@gmail.com
Github: github.com/brandonyph
Github: github.com/Lindseynicer
Twitter: Brandon_yeoph
Twitter: LianFoong/
Website: www.liquidbrain.org/videos
Single-cell RNAseq Analysis Walk-Through: NMF, Graph Clustering, XGBoost for Time-Series Samples
Join me in this concise walk-through video where I explore bioinformatic analysis techniques according to a paper published in Science in year 2020.
Using non-negative matrix factorization (NMF), graph-based clustering, and XGBoost machine learning, we analyze time-series samples and identify cell types for each cluster. Discover how NMF uncovers patterns, graph clustering reveals relationships, and XGBoost predicts and classifies.
Reference: Karthaus WR, Hofree M, Choi D, Linton EL, Turkekul M, Bejnood A, Carver B, Gopalan A, Abida W, Laudone V, Biton M. Regenerative potential of prostate luminal cells revealed by single-cell analysis. Science. 2020 May 1;368(6490):497-505. DOI: 10.1126/science.aay026
Github: github.com/Lindseynicer/scRNAseq-analysis-walkthrough-Reproducing-analysis-of-Karthaus-et-al-Science-2020/tree/main
Don't forget to like, subscribe, and share for more bioinformatics insights.
#Bioinformatics #DataAnalysis #TimeSeries #NMF #GraphClustering #XGBoost
Email: liquidbrain.r@gmail.com
Website: www.liquidbrain.org/videos
Patreon: www.patreon.com/liquidbrain
Переглядів: 1 756
Відео


10k subscribers "livestream"?
Переглядів 498Рік тому
Email: liquidbrain.r@gmail.com Website: www.liquidbrain.org/videos Patreon: www.patreon.com/liquidbrain

8 Tips and Tricks on R Markdown & Where have I been
Переглядів 1,3 тис.Рік тому
Script: github.com/brandonyph/LiquidBrain_Scripts Email: liquidbrain.r@gmail.com Website: www.liquidbrain.org/videos Patreon: www.patreon.com/liquidbrain

Expression data from cBioPortal, how to perform differential expression analysis on it?
Переглядів 1,9 тис.Рік тому
Hi, it's me Lindsey...I have been exploring the human cancer genomic database in cBioPortal for my day job. From zero knowledge to what I have explored so far, this Q was puzzling me a lot, but now I think I have a clearer thought to justify, what do you think about my strategy? Email: liquidbrain.r@gmail.com Website: www.liquidbrain.org/videos Patreon: www.patreon.com/liquidbrain

Minimal Reproducible Example | How to get help online?
Переглядів 367Рік тому
Well, I hope it helps with the troubleshooting in the future :) Email: liquidbrain.r@gmail.com Website: www.liquidbrain.org/videos Patreon: www.patreon.com/liquidbrain
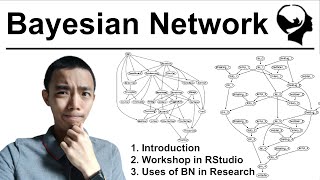
Bayesian Network | Introduction and Workshop
Переглядів 14 тис.Рік тому
Bayesian Network is a model that allows for probabilities of all events to be connected to each other and we could easily make decisions on the finally possible probabilities of something going to happen based on the information we already had. It been a very popular model for the last few decade due to its transparency in the nodes connectivity. In this video I try to go through the basic of B...

Restoring values after Normalisation in R
Переглядів 367Рік тому
Yes I cut my hair between shooting the thumbnail and filming the video. I was working on recreating the input from an Autocoder and figure out I could make a video on how to reverse the output to the original label. Thus this video Github Repo github.com/brandonyph/LiquidBrain_Scripts Look for Reverse Minmax Email: liquidbrain.r@gmail.com Website: www.liquidbrain.org/videos Patreon: www.patreon...

Is Scanpy faster then Seurat? | Part 1-Data Preprocessing
Переглядів 1,7 тис.2 роки тому
Two of the most popular tools in scRNA-Seq analysis uses very different platform and backend logic on how it is run. Python are always credit to be faster and more memory efficient, but R is more popular and more supported in most bioinformatics application. This is the part one of the series where I try to compare the differences between the speed between the two software to check how they can...

Variational Autoencoder | Introduction and Workshop
Переглядів 1,4 тис.2 роки тому
Variational Autoencoder is a more advance version of autoencoder. Instead of storing the latent vector directly in the neural network, it added another layer of gaussian function to allow for a more general representation of those latent vector. Typically, it allows for a better generation of data than GAN in certain situation. In this video I tried to walkthrough some basic introduction of VAE...
How to setup your computer for scanpy
Переглядів 2,6 тис.2 роки тому
As a long time R user, I am always trying to avoid setting another separate environment for my analysis so when something doesn't work, I dont have to spent the time to troubleshoot two locations. However, people have been telling me how python is actually better in almost everything and should be the default choice in bioinformatics analysis, I wanted give it a try. This is going to be the fir...
3 Free Courses for R | Beginner and Intermediate
Переглядів 2 тис.2 роки тому
Well, I mostly made this video to make sure people don't email me about making free course online about R programming. Email: liquidbrain.r@gmail.com Website: www.liquidbrain.org/videos Patreon: www.patreon.com/liquidbrain Chapters 0:00 Introduction 0:39 www.edx.org/ 1:44 www.datacamp.com/ 2:09 www.codecademy.com/ 2:43 bookdown.org/home/
cBioPortal for Human Cancer Genomics and why you should analyze the source data yourself
Переглядів 1,2 тис.2 роки тому
If you are doing cancer genomic research, you are aware that you should not rely 100% on the online interactive tools for mining the open-access, large-scale cancer genomic data sets. This video shares with you some tips to kickstart the data wrangling and analysis, as well as reasons why you should do-it-yourself using the source data. You can download the source data from cBioPortalData R pac...
No Code Seurat Analysis | Azimuth First Look
Переглядів 1,8 тис.2 роки тому
Most people dealing with data actually spent 80% of time cleaning the data and another 20% complaining about data not being clean in the first place. Developed as a Seurat extension, Azimuth aims to help to bypass most of the coding process to get from Seurat data directly into visualization and some simple data table. Being new, I am just trying out this for about 2 days and this is what i fin...
16s rRNA Sequencing Analysis and Visualization
Переглядів 15 тис.2 роки тому
16s rRNA Sequencing Analysis and Visualization
16s rRNA Sequencing Analysis | Mothur Walkthrough Part 1
Переглядів 12 тис.2 роки тому
16s rRNA Sequencing Analysis | Mothur Walkthrough Part 1
Cancer Somatic Mutation Analysis | MAFtools R Package
Переглядів 9 тис.2 роки тому
Cancer Somatic Mutation Analysis | MAFtools R Package
Can I make scRNA-Seq run faster in Seurat?
Переглядів 8662 роки тому
Can I make scRNA-Seq run faster in Seurat?
TCGA Biomarkers Identification using Machine Learning | Complete Walkthrough
Переглядів 8 тис.2 роки тому
TCGA Biomarkers Identification using Machine Learning | Complete Walkthrough
Average Expression in Seurat | The how not the why
Переглядів 2 тис.2 роки тому
Average Expression in Seurat | The how not the why
Software License Explained | MIT vs GLP3
Переглядів 7812 роки тому
Software License Explained | MIT vs GLP3
DEG isolation using limma voom | A Rstudio Tutorial
Переглядів 9 тис.2 роки тому
DEG isolation using limma voom | A Rstudio Tutorial
Why Negative Binomial is used in DESeq2?
Переглядів 13 тис.2 роки тому
Why Negative Binomial is used in DESeq2?
Gene Set Enrichment Analysis| GSEA algorithm
Переглядів 15 тис.2 роки тому
Gene Set Enrichment Analysis| GSEA algorithm
It is better than Microsoft Word | Writing in R Markdown
Переглядів 1,6 тис.2 роки тому
It is better than Microsoft Word | Writing in R Markdown
How to know if two genes are similar? | Semantic Similarity Explained
Переглядів 1,6 тис.2 роки тому
How to know if two genes are similar? | Semantic Similarity Explained
Why R Programming is better (For me) ?
Переглядів 8822 роки тому
Why R Programming is better (For me) ?
Williams Paul Jones George Martinez Scott
Fantastic video! Really really helpful and informative! I recommend! Thanks for your video!
wow. that's what I needed. thanks guys.
i did not find any external traits file in your github. can you provide?
Thanks for the information. How to visulaize CNV amplification data like how can i add amplification status like Amplification or Loss inside the input file? and amplificaation status want to see along with SNV.
Very informative. I have installed IBM CPLEX optimization Studio 22.1.1 (academia) in windows 11 machine. And I have R 4.3.1 . I have tried to link CPLEX in R studio but could not able to make it. If it is possible, could you please make a video how to link CPLEX with R ? I tried different solutions from stackoverflow or from Chatgpt but could not able to make it. There is not much working solution as well. Please can u upload the tutorial regarding this ? Thanks in advance :)
Informative and Detailed Video on UA-cam about CNN ever. Thanks for sharing.
thank you for this video. I have a problem when I want to open the image it does not appear (turns white) my_palette <- colorRampPalette(c("blue", "yellow", "orange", "red")) pheatmap(d_S1, col = my_palette(n = 10), kmeans_k = NA, breaks = NA, border_color = F, cellwidth = 50, cellheight = 50, scale = "none", cluster_rows = TRUE, cluster_cols = F, clustering_distance_rows = "euclidean", treeheight_row = 30, clustering_method = "complete", annotation_names_row = TRUE, annotation_names_col = TRUE, drop_levels = TRUE, show_rownames = TRUE, show_colnames = T, main = "FC", fontsize = 12, fontsize_row = 12, fontsize_col = 12, ) ggsave("FCC_S1.jpeg",units = "cm", width = 7, height = 4, dpi = 1000)
Hi, I am new to R, can you please tell me little about library(FactoMieR), please? I can not find it.
Thanks for the video, really understand HMM model. Can we have a video on how HMM works in haplotype phasing? :)
Are they all hg19? or are there hg38 cohorts?
u just saved my exam tmrw 😭
you displayed your group allocation poorly. needs to show that it's all part of the same for loop.. looked separate otherwise nice tutorial
Thank you so much
❤ Best tutor! Thanks!
❤ Best tutor! Thanks!
what if I am not using Miseq particularly ? and particular illumina platform is not specified when I get the data ?
what if i am not using Miseq particularly?
Thanks for the video, it is really useful!! It would have been nice if you showed the imported count_table like you did with the taxonomy file because you used a final.full.count_table that is not produced with the Mothur SOP, is it?? I think a few of us are struggling with the comment lines in the count_table in mothur. Any advice is greatly appreciated 🙃
thank you so much for this video, and thank you SO SO SO much for sharing the slides out <3
It would be nice to know where some of the functions you are using are coming from (without having to visit github). I cannot find locf, nobc or forbak in nomemica. I checked the zoo package. It does not have those but similar ones (na.locf for both LOCF and NOBC).
Nice presentation. However, I find difficult to find a good account of the difference between the different classes of missings (MCAR, MAR, MNAR). After reading the description of these types of classes by different youtubers I am just left a loss. Perhaps no one can explain these things?
This is a fantastic video. Thank you so much!
This video made my day. Thank!
why gender is not entered as random slope for the two random intercept
exprs(gse)[1,] > Error in exprs(gse)[1,] : subscript out of bound Why?
I have been trying to figure out this part of my analysis for so long and was struggling with where to even begin but this video was perfect! So easy to understand and straight to the point, you're amazing. Thank you!
How about lenovo loq intel i5 12450hx with 12gb ram and upgradable upto 32 gb. The only issue is its battery backup is around 3 to 3.5 hours.
when it comes to dealing with data science, python have most of modeling in Sklearn. You need pandas only to deal with data frames. In R there are 600 ways to open csv file! Also I find the RDS format in R extremely confusing. Agree that RStudio is more established and easier to work with. Jupyter Lab needs way more development to reach RStudio functionality.
I wonder if can upgrade the codes making it possible to use more CPU or GPU to analyse in order to reduce the use of memories.Because i found that excpet memories were highly used,the CPU and GPU were almost unused with the only 20%to30% occupying rates
Hello, could you please help me, I used this code to fit the trendline of my data, but the line did not show "> abline(lm(Rawdata$Elevation~Rawdata$Bulk, data=Rawdata))". What could be the possible problem? Your video has been helpful as I am a new user of R. I have successfully implemented your tips until this point. Thanks
Thank you so much for the explanation! Could you elaborate more about p adjusted value at 17:45 when you mentioned that it is for multiple gene comparison? Specifically, how does it relate to multiple gene comparisons? Does it account for the high number of differentially expressed genes we found?
I can clearly understand it because it is shown in action. Thank you for the very good explanation.
Im having a problem running Azimuth on my R studio. Did you happen to get it to work?
Can I compare more than 2 scenarios (more than just formal, informal, etc..) with LLM?
great video
Nice work
what can we do when this happens: > summary(exprs(gse)) GSM1480987 GSM1480988 GSM1480989 GSM1480990 GSM1480991 GSM1480992 Mode:logical Mode:logical Mode:logical Mode:logical Mode:logical Mode:logical ? Thank you for your video!!!!
insanely helpful, very clear explanation and workshop!
What’s the name of the song
Super useful, super clear. Thank you so much 😁
great explaination, thank you!
Thumbs up to you guys, what a wonderful channel, looking forward to see more bioinformatic enthusiasts in Malaysia
thanks you for this video - good explanation!
thanks! really helpful!
YES, IT IS VERY VERY HELPFUL FOR ME, THANK YOU!!! SO MUCH!!!
Great presentation, really helpful.
why Module eigenegene is called first conponent of PCA and why this First component is required in WGCNA. Average gene expression is of a module is not enough for ME caluculation.
Hey, thanks for this good instruction. I tried your code but it will only search for my first word? How can I analyze more than one word at the time?
great couple of videos. Very helpful